An investor's primary tool for monitoring the performance of a particular stock or index over time is a stock market graph. In this blog, we will discuss how to make a stock market graph in India.
Stock market graph are an essential tool for investors to monitor the performance of a particular stock or index over time. These graphs are used to display the price movements of stocks or indices over a specified period, and they provide valuable information about the market trends and patterns. In India, investors use stock market graphs to track the performance of the BSE Sensex and the NSE Nifty 50 indices.
What is a Stock Market Graph?
It is a visual representation of the performance of a particular stock, group of stocks, or stock market index over a specified period of time. It is a graphical representation of the historical price data of a particular security or index, which allows investors to quickly and easily see how the security has performed over time. It’s used to identify trends, and patterns and to make predictions about future price movements.
Stock market graphs typically plot the price of a stock or index on the y-axis and the time period on the x-axis.
It can be used to track the performance of individual stocks or entire markets. Investors may use It to help them make decisions about buying or selling securities, based on trends and patterns they observe in the data. Additionally, analysts and researchers may use stock market graphs to study the behavior of the market over time and to develop insights into economic conditions and market trends.
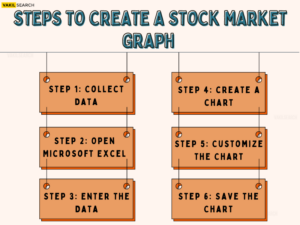
Create a Stock Market Graph Steps:

-
Step 1: Collect Data
The first step in creating a stock market graph is to collect the data for the index or stock you want to graph. In India, the data can be collected from financial websites such as Moneycontrol, NSE India, or BSE India. The data can be in the form of daily, weekly, or monthly price movements of the stock or index.
-
Step 2: Open Microsoft Excel
Once you have collected the data, open Microsoft Excel on your computer. Excel is a widely used spreadsheet program that can be used to create stock market graphs.
-
Step 3: Enter the Data
The next step is to enter the data into Excel. You will need to enter the date and the corresponding price of the stock or index for each day. The data can be entered into a table with two columns, one for the date and the other for the price.
-
Step 4: Create a Chart
After you have entered the data, select the data range that you want to include in the graph. Once you have selected the data range, click on the “Insert” tab on the Excel menu bar and select the “Line Chart” option from the “Charts” section. You can choose the type of line chart that you want to create, such as a simple line chart or a stacked line chart.
-
Step 5: Customize the Chart
Once you have created the chart, you can customize it to make it more informative and visually appealing. You can add chart titles, axis titles, and legends to the chart. You can also change the colors and styles of the chart elements to suit your preferences.
-
Step 6: Save the Chart
After you have customized the chart, save it in a format that you can easily share or use in your reports or presentations. You can save the chart as an image file or embed it in a Word or PowerPoint document.
Conclusion
Hence, creating a stock market graph is a straightforward process that can be done using Microsoft Excel. By following these steps, investors in India can monitor the performance of the BSE Sensex and the NSE Nifty 50 indices or any other stock of their choice. It provide valuable information about market trends and patterns, and they can help investors make informed decisions about their investments.
However, it is important to keep in mind that stock market data is subject to fluctuations, and past performance is not necessarily indicative of future results. Investors should always consult with a financial advisor before making any investment decisions. Further, to know more about the stock market, get in touch with our experts in Vakilsearch.

