Learn how Indian investors can navigate stock market volatility with confidence. Explore strategies for long-term success, diversification, risk assessment, and making informed investment decisions.
The stock market is known for its unpredictable nature, and navigating through its volatility can be a challenging task. However, with the right strategies and a long-term perspective, investors can mitigate risks and potentially achieve their financial goals. This article presents a list of effective tips specifically tailored for the Indian audience to navigate stock market volatility successfully.
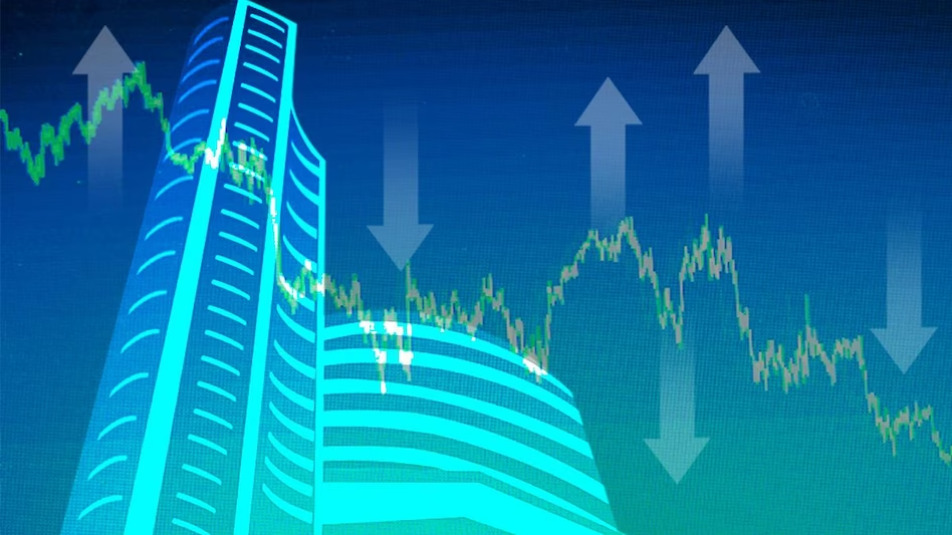
What is Stock Market Volatility?
Stock market volatility refers to the degree of variation in trading prices over time within a given market. It is often measured by indices such as the Volatility Index (VIX), which reflects the market’s expectations for future volatility. High volatility suggests greater uncertainty, with prices experiencing more significant fluctuations. The S&P 500 and Dow Jones Industrial Average (DJIA) are key benchmarks used to gauge overall market performance. Volatility can be influenced by various factors, including economic indicators, geopolitical events, and market sentiment. During periods of high volatility, investors may experience rapid and unpredictable changes in the value of their investments, contributing to both risk and opportunity.
In financial markets, volatility plays a crucial role in determining market conditions. A bull market is characterised by rising prices and generally low volatility, while a bear market involves falling prices and heightened volatility. Blue-chip stocks, representing large, stable companies, are often considered less volatile than smaller, growth-oriented stocks. Investors use options and engage in short selling to manage or capitalise on volatility. Market corrections, temporary reversals in prevailing trends, can lead to increased volatility. Circuit breakers are mechanisms designed to temporarily halt trading during extreme market fluctuations, providing a brief pause to allow for reassessment and reduce panic-driven selling. Overall, understanding and navigating stock market volatility is essential for investors seeking to make informed decisions in dynamic financial environments.
Measuring Stock Market Volatility
Measuring stock market volatility is important for investors because it can help them to understand the risks associated with different stocks and portfolios. There are a number of different ways to measure volatility, but the most common measures include:
- Standard Deviation: Standard deviation is a statistical measure of how spread out a set of data points is from the mean. In the context of stock market volatility, standard deviation is used to measure how much a stock’s price fluctuates over time. A higher standard deviation indicates greater volatility
- Beta: Beta is a measure of a stock’s volatility relative to the overall market. A beta of 1.0 indicates that a stock’s price moves in line with the market. A beta of greater than 1.0 indicates that a stock’s price is more volatile than the market, while a beta of less than 1.0 indicates that a stock’s price is less volatile than the market
- Volatility Index (VIX): The VIX is a measure of the implied volatility of S&P 500 index options. It is often referred to as the “fear gauge” of the stock market. A higher VIX indicates higher implied volatility and therefore greater perceived risk by market participants.
Once you have chosen a measure of volatility, you can use it to compare different stocks and portfolios. For example, if you are considering investing in two different stocks, you can compare their standard deviations to get a sense of which stock is more volatile. Similarly, you can compare the betas of different stocks to see which stocks are more closely correlated to the market
You can also use volatility measures to track changes in volatility over time. For example, you can track the VIX to see how investors’ perceptions of risk are changing
All volatility measures have their own limitations. For example, standard deviation is a backward-looking measure, which means that it does not take into account future volatility. Beta is also a backward-looking measure, and it is only useful for measuring volatility relative to the market. The VIX is a forward-looking measure, but it is based on implied volatility, which is not always accurate.
Why is Stock Market Volatility Important?
- Volatility reflects changes in investor sentiment, indicating how optimistic or pessimistic market participants are about the future
- Higher volatility often implies greater risk, influencing investment decisions as investors assess potential returns against the associated risks
- Volatility can signal shifts in market trends. Sustained periods of high volatility may indicate a potential change in the market’s direction
- Investors use volatility to diversify and manage their portfolios effectively, adjusting their holdings based on market conditions
- Volatility is a crucial factor in options pricing. Higher volatility generally leads to higher option premiums, impacting trading strategies and potential profits
- Volatility can be linked to economic events and indicators, providing insights into economic stability and potential market reactions
- Volatility affects major indices like the S&P 500, Dow Jones Industrial Average (DJIA), and Nasdaq. Tracking volatility helps investors gauge the overall health of these benchmarks
- Volatility is often associated with market cycles. A sudden spike can signal the start of a bear market, while lower volatility may characterise a bull market
- Also known as the ‘fear gauge’ the VIX measures market expectations for future volatility. It is widely used to assess overall market sentiment
- Volatility plays a role in market corrections, reflecting sudden and significant price adjustments. Understanding volatility helps investors navigate these corrections.
How to Calculate Stock Market Volatility?
The most common way to calculate stock market volatility is to use the standard deviation of the stock’s daily returns. The standard deviation is a statistical measure of how spread out the data is around the mean. In the context of stock market volatility, it measures how much the stock’s price fluctuates on a daily basis.
To calculate the standard deviation of the stock’s daily returns, you will need to gather the stock’s closing prices over a period of time. Once you have the closing prices, you can use the following steps:
- Step 1: Calculate the mean (average) closing price for the period
- Step 2: Subtract the mean closing price from each daily closing price
- Step 3: Square the differences from step 2
- Step 4: Sum the squared differences
- Step 5: Divide the sum of squared differences by the number of data points minus 1
- Step 6: Take the square root of the result from step 5.
The result is the standard deviation of the stock’s daily returns. This number can be expressed as a percentage by multiplying by 100.
For example, let’s say you want to calculate the volatility of the S&P 500 index over the past 10 days. The following table shows the closing prices for the S&P 500 index over the past 10 days:
Date |
Closing Price |
| 2023-11-01 | 3,800 |
| 2023-11-02 | 3,850 |
| 2023-11-03 | 3,825 |
| 2023-11-04 | 3,875 |
| 2023-11-07 | 3,810 |
| 2023-11-08 | 3,835 |
| 2023-11-09 | 3,860 |
| 2023-11-10 | 3,840 |
Types of Stock Market Volatility
- Historical volatility: This is a measure of how much a stock’s price has fluctuated in the past. It is calculated using the standard deviation of the stock’s daily returns
- Implied volatility: This is a forward-looking measure of how much a stock’s price is expected to fluctuate in the future. It is calculated using the prices of options contracts on the stock
- Skewness: This measures how asymmetrical the distribution of a stock’s returns is. A positive skewness means that the stock has a higher probability of generating positive returns, while a negative skewness means that the stock has a higher probability of generating negative returns
- Kurtosis: This measures how peaked or flat the distribution of a stock’s returns is. A high kurtosis means that the stock has a higher probability of generating large returns, while a low kurtosis means that the stock has a lower probability of generating large returns.
- Volatility smile: This is a term used to describe the relationship between implied volatility and strike price for options contracts on a stock. The volatility smile is typically upward sloping, meaning that implied volatility is higher for options with out-of-the-money strike prices than for options with at-the-money strike prices
- Jump risk: This is the risk of a sudden and large movement in a stock’s price. Jump risk is difficult to measure and quantify, but it is an important consideration for investors who are investing in volatile stocks
- GARCH (generalised autoregressive conditional heteroskedasticity): This is a statistical model that is used to model volatility. The GARCH model is based on the assumption that volatility is not constant, but rather varies over time.
Historical Stock Market Volatility
Historical stock market volatility is the degree to which stock prices have fluctuated in the past. It is typically measured using the standard deviation of stock returns over a period of time. A higher standard deviation indicates higher volatility, meaning that stock prices are more likely to move sharply in either direction
Historical volatility has varied significantly over time. For example, the standard deviation of the daily returns of the S&P 500 index has been as low as 10% in some periods and as high as 30% in other periods. The average standard deviation of the S&P 500 index over the past 50 years has been approximately 15%
There are a number of factors that can contribute to historical stock market volatility. These include economic factors such as GDP growth and unemployment, geopolitical factors such as wars and terrorist attacks, and financial factors such as interest rates and inflation
Historical stock market volatility is an important consideration for investors. Investors who are risk-averse may want to avoid investing in stocks with high historical volatility. Investors who are seeking higher returns may be willing to invest in stocks with higher volatility, but they should be aware of the risks involved.
What Drives Stock Price Volatility?
Stock price volatility is influenced by a multitude of factors. Market sentiment, economic indicators, and company earnings reports play pivotal roles. Geopolitical events, changes in interest rates, and unexpected news contribute to fluctuations
Technological advancements, market conditions, and traders’ reactions amplify volatility. Investors closely monitor macroeconomic trends and global developments, as shifts in these areas can significantly impact stock prices. The complex interplay of these elements creates an environment where prices can quickly change, reflecting the dynamic nature of financial markets. Understanding and reacting to these diverse factors is essential for investors navigating the ever-changing landscape of stock price movements.
Importance of Navigating Stock Market Volatility
Navigating stock market volatility is of utmost importance for investors due to its potential impact on investment portfolios and long-term financial goals. Stock market volatility refers to the rapid and significant fluctuations in stock prices driven by various factors such as economic conditions, geopolitical events, and investor sentiment. By effectively navigating market volatility, investors can mitigate potential losses, capitalize on opportunities, and maintain their confidence in the investment process.
One key reason to navigate stock market volatility is to protect investment portfolios from significant downturns. Volatile markets can lead to rapid declines in stock prices, which can negatively impact the value of investment holdings. By employing strategies such as diversification, risk management, and fundamental analysis, investors can reduce the overall risk exposure of their portfolios and potentially minimize losses during turbulent times.
Understanding the Nature of Stock Market Volatility
Understanding the nature of stock market volatility is essential for investors to navigate the ups and downs of the financial markets. Stock market volatility refers to the rapid and unpredictable fluctuations in stock prices over a given period. It is driven by various factors such as economic indicators, geopolitical events, market sentiment, and company-specific news. Stock market volatility is an inherent characteristic of financial markets and is influenced by a multitude of factors that can impact investor behavior. It is crucial to recognize that volatility is a natural and expected occurrence in the stock market. Prices can experience significant swings, both upwards and downwards, in response to changing market conditions.
Benefits of Effective Strategies in Volatile Markets
| Benefits of Effective Strategies in Volatile Markets | Description |
| Risk Mitigation |
Effective strategies help mitigate the risk of significant losses during volatile market conditions by diversifying portfolios, implementing risk management techniques, and avoiding impulsive decisions based on emotions. |
| Capitalizing on Opportunities |
Investors can identify and take advantage of opportunities presented during volatile markets, such as buying quality stocks at discounted prices or investing in sectors poised for growth, resulting in potential gains. |
| Long-Term Wealth Accumulation |
Effective strategies help investors stay focused on their long-term goals and resist making short-term decisions driven by market fluctuations, leading to consistent wealth accumulation and increased financial stability |
| Enhanced Portfolio Stability |
Implementing effective strategies, such as diversification across asset classes and sectors, can reduce the impact of market volatility on portfolios, promoting stability and potentially minimizing losses during turbulent times. |
| Improved Emotional Control |
Following a well-defined strategy helps investors maintain emotional control, avoiding impulsive decisions and staying disciplined amidst market volatility. |
Proven Strategies for Indian Investors to Navigate Stock Market Volatility
-
Invest for the Long Term
Investing with a long-term mindset is crucial when dealing with stock market volatility. Short-term fluctuations are part of the market’s natural cycle, and panic-selling during these periods can lead to significant losses. By staying invested for the long run, investors can ride out market downturns and capitalize on long-term growth opportunities.
-
Value Diversification
Diversification is an essential risk management technique that helps reduce the impact of stock market volatility. It involves spreading investments across various asset classes, sectors, and geographical regions. By diversifying their portfolios, investors can lower the overall risk and increase the potential for stable returns. A well-diversified portfolio should include a mix of stocks, bonds, mutual funds, real estate, and other investment instruments.
-
Consider Investments in SIP, STP, and Booster STP
Systematic Investment Plans (SIP), Systematic Transfer Plans (STP), and Booster STP are investment strategies that can help navigate stock market volatility effectively:
-
SIP
Investing in SIP allows investors to invest a fixed amount regularly, regardless of market conditions. It averages out the cost of investments over time, reducing the impact of market volatility.
-
STP
Systematic Transfer Plans involve transferring funds from one investment to another at regular intervals. During volatile times, investors can gradually shift their investments from high-risk assets to relatively safer options.
-
Booster STP
Booster STP combines the benefits of SIP and STP. It allows investors to gradually increase the investment amount at predefined intervals, providing an additional boost during market downturns.
-
Consider the Risk Appetite
Understanding one’s risk appetite is vital when investing in the stock market. It refers to an individual’s ability to tolerate fluctuations and potential losses. Conservative investors should focus on low-risk investments, such as fixed deposits and bonds, while aggressive investors may be willing to take on higher risks for potentially higher returns. By aligning investment decisions with their risk tolerance, investors can make informed choices during periods of stock market volatility.
Key Factors to Consider During Stock Market Volatility
| Tips for Navigating Stock Market Volatility | Description |
| Fundamental Analysis | – Focus on evaluating the financial performance, management, competitive position, and growth prospects of companies before investing. |
| – Investing in fundamentally strong companies increases the likelihood of successfully weathering market turbulence. | |
| Keep Emotions in Check | – Avoid making impulsive decisions based on short-term market fluctuations. |
| – Stay rational, stick to the investment plan, and seek professional advice if needed. | |
| Monitor Portfolio Regularly | – Regularly monitor the investment portfolio without overreacting to short-term market movements. |
| – Periodically rebalance the portfolio to align with long-term goals and adjust allocations based on market conditions and risk appetite. | |
| Take Advantage of Opportunities | – Consider investing in quality stocks at discounted prices during market downturns. |
| – Conduct thorough research and analysis to ensure alignment with long-term investment strategy. |
FAQs
Is stock market volatility good?
Volatility can be both good and bad for investors. It can create opportunities to buy stocks at lower prices, but it can also lead to losses if stock prices fall sharply.
What causes high volatility in the stock market?
There are many factors that can cause high volatility in the stock market, including economic uncertainty, interest rate changes, geopolitical events, and corporate scandals.
Is market volatility a risk?
Yes, market volatility is a risk for investors. It can lead to losses if stock prices fall sharply. However, investors can mitigate this risk by diversifying their portfolios and investing for the long term.
Is market volatility increasing?
It is difficult to say definitively whether market volatility is increasing or decreasing. However, some experts believe that volatility is likely to remain elevated in the near future due to economic and geopolitical uncertainty.
Which volatility is better?
There is no one-size-fits-all answer to this question. The best volatility for an investor will depend on their individual risk tolerance and investment goals. Investors who are willing to take on more risk may prefer higher volatility, as it can lead to higher returns. Investors who are more risk-averse may prefer lower volatility, even if it means lower returns.
What if volatility is high?
If volatility is high, investors should be careful about making any major changes to their portfolios. They should also consider rebalancing their portfolios to ensure that they are still aligned with their risk tolerance and investment goals.
What is the volatility 75 index?
The volatility 75 index is a measure of the volatility of the 75th percentile of S&P 500 stocks. It is used by investors to gauge the riskiness of the stock market.
Which is the most volatile market?
Emerging markets are generally considered to be the most volatile markets. This is because they are more sensitive to economic and geopolitical events.
How is volatility calculated?
Volatility is typically calculated using the standard deviation of stock prices over a period of time. The standard deviation is a measure of how spread out the data is. A higher standard deviation indicates higher volatility.
What is a good volatility percentage?
There is no one-size-fits-all answer to this question. A good volatility percentage for an investor will depend on their individual risk tolerance and investment goals. Investors who are willing to take on more risk may be comfortable with a higher volatility percentage. Investors who are more risk-averse may prefer a lower volatility percentage.
What is an example of volatility?
An example of volatility is the stock market crash of 2008. During this time, the stock market experienced extreme volatility, with stock prices falling sharply.
Will the stock market correct in 2023?
It is impossible to say for certain whether the stock market will correct in 2023. However, some experts believe that a correction is likely, given the current economic and geopolitical uncertainty.
Conclusion
Stock market volatility is an inherent characteristic of investing, but with the right strategies and a long-term perspective, investors can navigate through these turbulent times successfully. By investing for the long term, diversifying their portfolios, utilizing investment strategies like SIP, STP, and Booster STP, considering their risk appetite, and making informed decisions based on fundamental analysis, Indian investors can better manage the impact of stock market volatility and work towards achieving their financial goals. It is important to remember that seeking professional advice and staying disciplined throughout the investment journey are key factors in navigating the stock market successfully. Vakilsearch can assist investors in navigating stock market volatility. With our expertise, Vakilsearch can help investors understand the legal and regulatory aspects of investing, ensuring compliance with applicable laws. Contact us today.
Read more:-